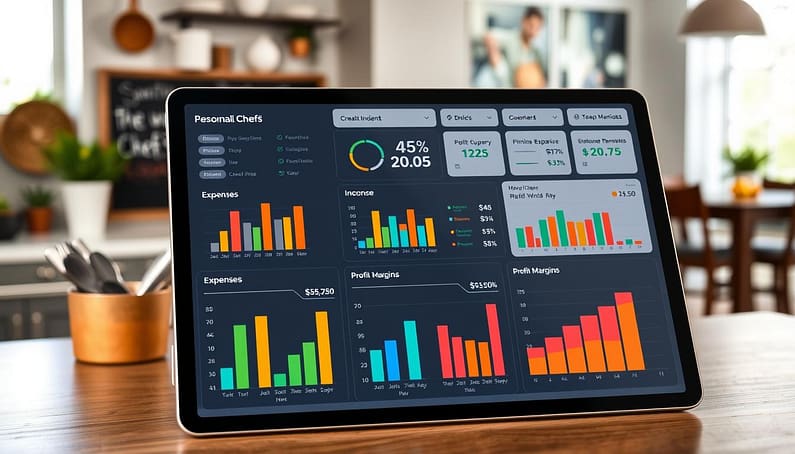
Welcome to a world where cooking meets smart money moves. If you’re a personal chef, knowing your finances is key. But, “financial metrics” might sound as exciting as old food. Don’t worry, we’re here to make it more appealing.
Imagine a simple page that shows you important financial info. What if tracking your money was as fun as making a perfect soufflé? We’ll show you key numbers every chef should watch. You’ll learn to track your earnings, spending, and profits easily.
Exploring this topic means more than just numbers. It’s about making your cooking business better. So, put on your apron and let’s get clear on your finances!
North stars owner pay and free cash flow targets
Let’s explore your financial strategy: pay and cash flow. Setting clear financial targets is key for personal chefs. It’s easy to overlook your income after expenses. But, if you don’t set a target, the market will, and it might not be fair.
Start by setting two income targets: your take-home pay and a reinvestment fund. This isn’t just dreaming big; it’s about aligning your goals with your life costs. Running your kitchen with confidence, knowing your earnings needs, is not a fantasy but a strategy.
Setting Your Take-Home Pay Target Without Guesswork
When setting your take-home pay, precision is essential. Many chefs underestimate their worth, leading to underpricing. You must calculate your income based on living expenses and savings goals. This is about more than just bills; it’s about living well.
Free Cash Flow as Your True North Metric
Now, let’s look at free cash flow, your true north metric. It’s like checking your business’s pulse: revenue minus costs. If it’s not positive and growing, you’re running a nonprofit. Understanding your free cash flow is key; it shows if you’re building wealth or just busy.
Why Most Personal Chefs Underprice (And Stay Stuck)
Many talented personal chefs underprice, often due to not knowing their true costs. This is a dangerous trap. Feeling guilty about charging what you’re worth is normal. Remember, a high price isn’t greed; it’s necessary.
The Capacity Math Reality Check
Capacity math is about calculating how many events you can handle. It’s not just accounting; it’s the basis of pricing with confidence. If you’re maxed out, adjust your pricing. Ignoring your limits can lead to stress and burnout.
Understanding these financial metrics can change your life. You’ll go from stressed chef to savvy business owner. For more insights, check out Copley Equity.
Revenue mix weekly prep events tastings classes gift cards
In the world of personal chefs, knowing your revenue mix is key. It’s like navigating a culinary buffet, where each dish has its place. If your income comes from “whatever the client asks for,” you’re more like a culinary concierge than a business owner. Let’s look at your income streams like a hedge fund manager would, with precision and strategy.
Mapping Your Revenue Streams Like a Portfolio Manager
Think of your income streams as a carefully curated menu. You have:
- Weekly Meal Prep: Steady and predictable, but labor-intensive.
- Private Events: High-ticket and high-pressure—glorious when they work.
- Tastings: Low direct revenue, but with astronomical conversion.
- Cooking Classes: Scalable, content-generating, and an ego boost.
- Gift Cards: Interest-free loans from clients who may never redeem them.
It’s important to understand how your income streams work together. A tasting is more than just a tasting; it’s a sales pitch. A cooking class is a chance to attract new clients.
The Gift Card Goldmine Nobody Talks About
Gift cards are often overlooked, but they’re a goldmine. The breakage rate can quietly add to your profits. They’re like interest-free loans from clients who might forget they have them!
Weekly Prep vs. Events: A Margin Comparison
When comparing weekly prep to events, consider the margins:
| Service Type | Revenue | Labor Intensity | Client Engagement |
|---|---|---|---|
| Weekly Prep | Steady | High | Regular |
| Private Events | High | Very High | Occasional |
Tastings and Classes as Marketing ROI, Not Just Revenue
Tastings and classes are more than just income. They’re marketing tools that boost your brand. By doing these, you earn income and make lasting impressions. This leads to more bookings in the future.

Cost lines food containers labor travel overhead software insurance
Being a personal chef can be like navigating a maze of hidden expenses. Food costs get a lot of attention, but other costs can quietly eat away at your profits.
Let’s explore the hidden costs that personal chefs need to watch out for. It’s not just about the food; think about containers and packaging. Those trendy bamboo clamshells cost more than you might think. And don’t forget about labor costs. Your time and any help you hire should reflect your skills, not just minimum wage.
The Hidden Cost Lines That Quietly Bleed Your Margin
Then there are travel costs. Fuel, vehicle wear and tear, and dealing with traffic all add up. Overhead costs, like kitchen rentals and software subscriptions, also eat into your profits. And don’t overlook transaction fees—those small charges can add up quickly.
Fixed vs. Variable Costs: Know the Difference or Die Trying
It’s key to know the difference between fixed and variable costs. Fixed costs, like rent and insurance, stay the same no matter how much you produce. Variable costs change with how much you make. Understanding this can help you plan better.
Insurance and Software: The Unsexy Line Items That Save You
Now, let’s talk about the less exciting costs: insurance and software. Liability insurance might not be exciting, but it’s vital for protecting your business. Good software for scheduling and invoicing can also save you time and stress.
Travel Costs and the IRS Mileage Rate Trap
Lastly, watch out for the IRS mileage rate trap. Many personal chefs underestimate their travel costs, which can lead to financial trouble. Keep accurate records of your mileage to make sure you’re getting the most out of your deductions.
The goal is not to get rid of costs but to see them clearly. A cost you can’t see is a cost you can’t control. And a cost you can’t control is a cost that controls you.
Core ratios food cost labor minutes per service gross margin per service
Mastering core ratios is key for personal chefs, like perfecting a soufflé. These ratios—food cost percentage, labor minutes per service, and gross margin per service—are vital for your financial health. They help you navigate the culinary business world with confidence.
Food Cost Percentage: The Non-Negotiable Baseline
Your food cost percentage is the cornerstone of your financial dashboard. To find it, use the formula: (Total Cost of Ingredients / Total Sales Price) x 100. This number is not just a statistic; it directly affects your gross margin. Make sure to include every ingredient, even that pinch of Maldon salt. If not, you might be underestimating your true costs, leading to an inflated food cost percentage.
Why “Food Cost %” Alone Is a Dangerous Oversimplification
Just looking at food cost percentage can be misleading. It doesn’t tell the whole story. Combine it with labor minutes and gross margin for a complete picture. A 28% food cost might seem ideal, but what if your labor minutes are sky-high? That’s where the real conversation begins.
Labor Minutes Per Service: Time Is Literally Money
Now, let’s talk about labor minutes per service. This metric is often overlooked but is vital for your profitability. If you spend 14 hours on a dinner party and charge $1,500, your effective hourly rate is $107 before costs. Is that sustainable? You can’t answer that question without measuring it.
Calculating Labor Minutes With Precision, Not Guesswork
To calculate labor minutes accurately, track every step of your process—from shopping to clean-up. This data is essential for understanding how much time you invest in each service. The more precise your calculations, the clearer your financial picture will be.
Gross Margin Per Service: Your Real Profit Signal
Lastly, let’s look at gross margin per service. This figure shows if you’re making money after direct costs. For example, if you host a $1,200 dinner with $380 in food, $300 in labor, and $80 in travel, your gross margin is $440, or 36.7%. Is that healthy? It depends on your overhead, but at least you’re now having an honest conversation with yourself.

Capacity utilization cook days per week families per route hours per day
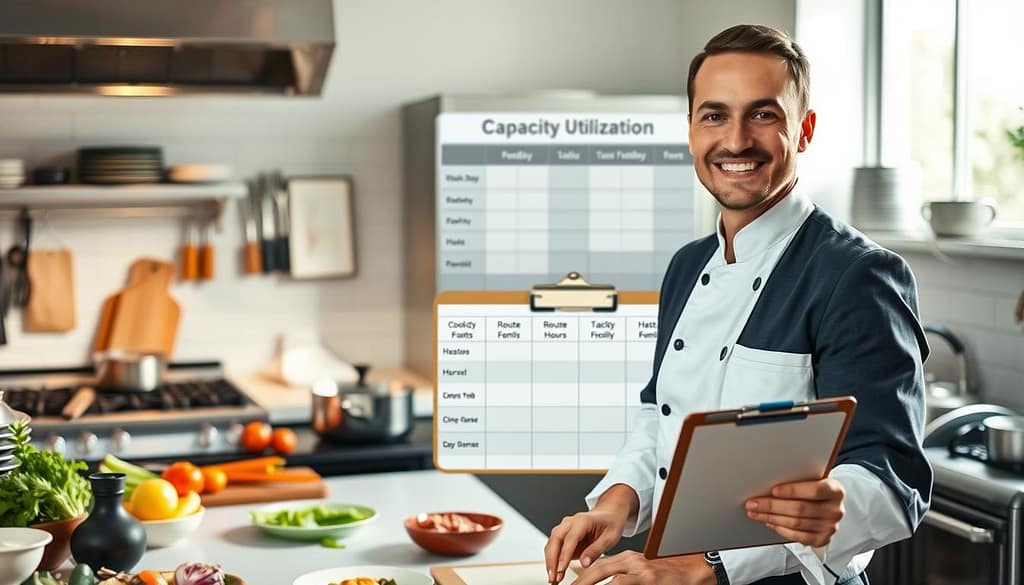
In the world of personal chefs, knowing how to use your time is key. It’s like having a sharp knife—it’s essential. Finding the right balance can make all the difference between success and burnout. So, how do you know when you’ve reached your limit without losing your mind? Let’s explore the numbers.
Defining Your Maximum Sustainable Output
Capacity utilization is what keeps you going without burning out. It’s like a financial reality check. It helps you figure out how many clients or events you can handle without losing your sanity.
- Time Capacity: The hours you can realistically work each week.
- Event Capacity: The number of events you can manage without sacrificing quality.
- Client Capacity: How many families you can serve effectively on a single route.
Families Per Route: The Logistics of Scaling
How many families can you serve on one route before it gets too hard? Finding the right number is key. Too many and you risk rushing services and unhappy clients.
Cook Days Per Week: Quality vs. Quantity at the Breaking Point
Deciding how many days a week to cook is all about balance. Can you handle six events in seven days without losing your touch? Aim for 70-85% utilization. This way, you can stay profitable, present, and avoid last-minute cancellations.
Hours Per Day and the Burnout Threshold
How many hours a day can you work before it’s not worth it? Keep track of your hours carefully. Sometimes, saying no to a booking is the smartest move. It prevents mistakes, errors, and damaged client relationships due to exhaustion.
Lead funnel inquiries consults close rate average order value
Turning an inquiry into a booked client is like finding your way through a maze. Your lead funnel is where people first see what you offer. It has four key parts: inquiries, consults, close rate, and average order value. Knowing each part helps you get better at attracting clients.
Mapping Your Client Acquisition Funnel End to End
Begin with inquiries, the first touchpoints from various sources. These are the heart of your business. But not all inquiries are the same. You aim to turn them into consults, where you can check if they’re a good fit.
Close Rate Diagnostics: Why Prospects Ghost You
The close rate shows how many consults turn into clients. If it’s under 50%, your sales process needs a review. Are your proposals clear and compelling? A good proposal can make a big difference in your close rate.
Average Order Value: Upselling Without Feeling Like a Salesperson
The average order value shows if you’re attracting the right clients. Sometimes, the difference between a $900 and a $1,400 client isn’t just size. Adding extras like wine pairings can increase revenue without much extra cost.
Inquiry-to-Consult Conversion: Plugging the Leaks
Improving inquiry-to-consult conversion is key. Look at where people drop off in your funnel. Are you following up quickly and with personalized offers? Fixing these issues can make your funnel more efficient.
AR aging and DSO collections health
Imagine making a perfect dish, but clients take forever to pay. Welcome to AR aging, a financial challenge. It can turn your great dishes into a cash flow problem. Even with the best recipes, slow payments can feel like free loans.
Let’s explore how to get your cash flow back on track.
Accounts Receivable Aging: The Silent Cash Flow Killer
Accounts receivable aging shows how long invoices are unpaid. It’s like a timeline for your invoices. Invoices are grouped by age:
| Days Outstanding | Invoice Status | Action Needed |
|---|---|---|
| 0-30 Days | Fresh | Monitor |
| 31-60 Days | Stale | Follow Up |
| 61-90 Days | Old | Escalate |
| 90+ Days | Probably Never | Consider Firing |
This table shows how unpaid invoices can hurt your cash flow. Waiting too long can harm your finances.
DSO (Days Sales Outstanding): What the Number Actually Means
DSO measures how long it takes to get paid after invoicing. A DSO under 14 days is good; over 30 days is a warning. Over 45 days, it’s time to rethink your business.
Is your client a bad credit risk? Sometimes, the best choice is to let them go—nicely.
Collection Health: When to Fire a Client Over Payment Patterns
Listening to payment signs is key. Clients who miss deadlines often are sending a message. You deserve clients who value your time and skills.
If their payment habits are a problem, it’s time to part ways. It’s business, not personal.
Payment Terms That Protect Your Cash Flow Without Alienating Clients
Clear payment terms are vital. Consider a 50% deposit upfront and final payment seven days before. Saying “the menu will be finalized upon payment” can make a transaction special.
Visual dashboard build Sheets or Notion and mobile snapshot
Imagine a dashboard as easy to use as your favorite app, but for your kitchen empire. In today’s world, a good dashboard is key. It helps you track everything you need to stay ahead.
When building your dashboard, you face two big choices: Google Sheets and Notion. Each has its own good and bad points. Picking the right one can really change how you work.
Google Sheets vs. Notion: The Dashboard Platform Showdown
Google Sheets is free, flexible, and great for teamwork. But, it needs manual setup and might look messy if you’re not good at design. Notion, on the other hand, has a sleek design and works well on phones. But, it can be hard to learn.
Mobile Snapshot: Your Pocket CFO for On-the-Go Decisions
Your dashboard must look good on your phone. Personal chefs are always on the move. A mobile-friendly dashboard is key for quick decisions.
Building a One-Page Visual Dashboard That Doesn’t Overwhelm
Let’s talk about a one-page dashboard. It should only show important info. Here are the top metrics to consider:
| Metric | Description | Importance |
|---|---|---|
| Revenue Month-to-Date | Your earnings for the current month | Critical for tracking financial health |
| Food Cost % | Percentage of revenue spent on food | Essential for maintaining profitability |
| Labor Minutes per Service | Time spent on each service | Directly impacts efficiency |
| Gross Margin per Service | Profit after costs per service | Indicates overall business health |
| Capacity Utilization | How effectively you’re using your resources | Helps in scaling your business |
Key Metrics to Display at a Glance Without Analysis Paralysis
Choosing the right metrics is key. Pick 8-10 important ones for your dashboard. These should include your close rate and free cash flow. Don’t clutter your dashboard with unnecessary info.
With a clear dashboard, you can quickly see if your business is doing well. Ready to make your dashboard? Check out this guide on using booking platforms to attract new clients for more tips!
Cadence weekly 30 min review with actions
Having a regular review process is not just smart; it’s essential for your business’s success. A weekly 30-minute review can be the lifeline that keeps your operations afloat. It’s like a ritual that turns numbers into actionable insights.
Begin with a quick five-minute overview of your top-line metrics. This includes your revenue, cash position, and any red flags. Then, spend 15 minutes diving into the details. Ask yourself, why did your food costs spike this week? What caused the labor minutes per service to creep up? These questions matter.
The Weekly Review Ritual: Why Consistency Beats Intensity
In the hustle and bustle of running a personal chef business, it’s easy to let the numbers slide. But consistency is key. By setting aside the same day and time each week, you create a rhythm that allows you to stay ahead of issues. Remember, the most beautiful dashboard is useless if it collects dust like a forgotten trophy.
Action Items: From Insight to Implementation in 30 Minutes
After scrutinizing the variances, dedicate the final 10 minutes to crafting action items. Each KPI should have a named owner, even if you’re a solo operator. When your food cost percentage drifts above target, who investigates? When accounts receivable aging stretches past 30 days, who follows up? If your answer is “I guess I do, eventually,” you’ve just identified your bottleneck.
Why 30 Minutes Is the Magic Number for Sustained Attention
The 30-minute constraint is deliberate. It’s long enough to dig deep but short enough to survive a busy week without being deprioritized. Any longer, and it risks becoming the thing you promise to “get to on Sunday”—and we all know how that story ends.
Accountability: Assigning Ownership to Each KPI
Accountability is vital. Each KPI should have a clear owner responsible for monitoring and taking action. If a KPI is off-target, don’t just “keep an eye on it.” Write down one corrective action and a deadline. This simple rule, borrowed from the Altametrics methodology, transforms your dashboard from a passive report into a proactive tool.
Download template and SOPs
Ready to turn insight into action? Get your free KPI dashboard template and dive into data-driven decision-making. It’s not just a spreadsheet; it’s your new best friend for managing your personal chef business. With all formulas pre-loaded, you can track food costs, labor minutes, and gross margins easily, no data science degree needed.
Your Free KPI Dashboard Template: Plug, Play, Profit
This template is ready for immediate use. Just plug in your numbers, and it will calculate your key performance indicators. It’s like having a personal financial advisor, but without the high fees. You’ll see your metrics come to life, helping you make informed decisions quickly.
Standard Operating Procedures for Dashboard Consistency
To keep your dashboard effective, consistency is key. Set a routine for updating metrics. Update cash positions daily, ratios weekly, and trends monthly. Assign someone to enter data to ensure accountability. Remember, knowledge is power, but only if you act on it.
How to Customize the Template for Your Specific Business Model
Every chef has a unique style. Customize the template to fit your business model. Change categories and metrics that are most important to you. Tailoring it to your needs will make it more effective and relevant.
Implementation Checklist: From Download to Daily Use in 7 Days
Follow this simple checklist to make your new dashboard a part of your routine. Start by inputting last month’s historical data. Set your targets on Day 2. Track your first real-time service by Day 3. By Day 7, you’ll be ready for your first weekly review, complete with actionable insights. This isn’t just theory; it’s your business quantified and under control.